In today’s market, business success often lies in the ability to glean accurate insights and predictions from data. However, data scientists and analysts often find that the data they have at their disposal isn’t enough to help them make accurate predictions for their use cases. A variety of factors might alter an outcome and should be taken into account when making a prediction model. Google Trends is an available option, presenting a broad source of data that reflects global trends more comprehensively. This can help enrich a dataset to yield a better model.
You can use Google Trends data for a variety of analytical use cases. For example, you can use it to learn about how your products or brands are faring among targeted audiences. You can also use it to monitor competitors and see how well they’re performing against your brand.
In this post, we shows how to get Google Trends data programmatically, integrate it into a data pipeline, and use it to analyze data, using Amazon Simple Storage Service (Amazon S3), AWS Glue, Amazon Athena, and Amazon Quick Sight. We use an example dataset of movies and TV shows and demonstrate how to get the search queries from Google Trends to analyze the popularity of movies and TV shows.
Solution overview
The following diagram shows a high-level architecture of the solution using Amazon S3, AWS Glue, the Google Trends API, Athena, and Quick Sight.
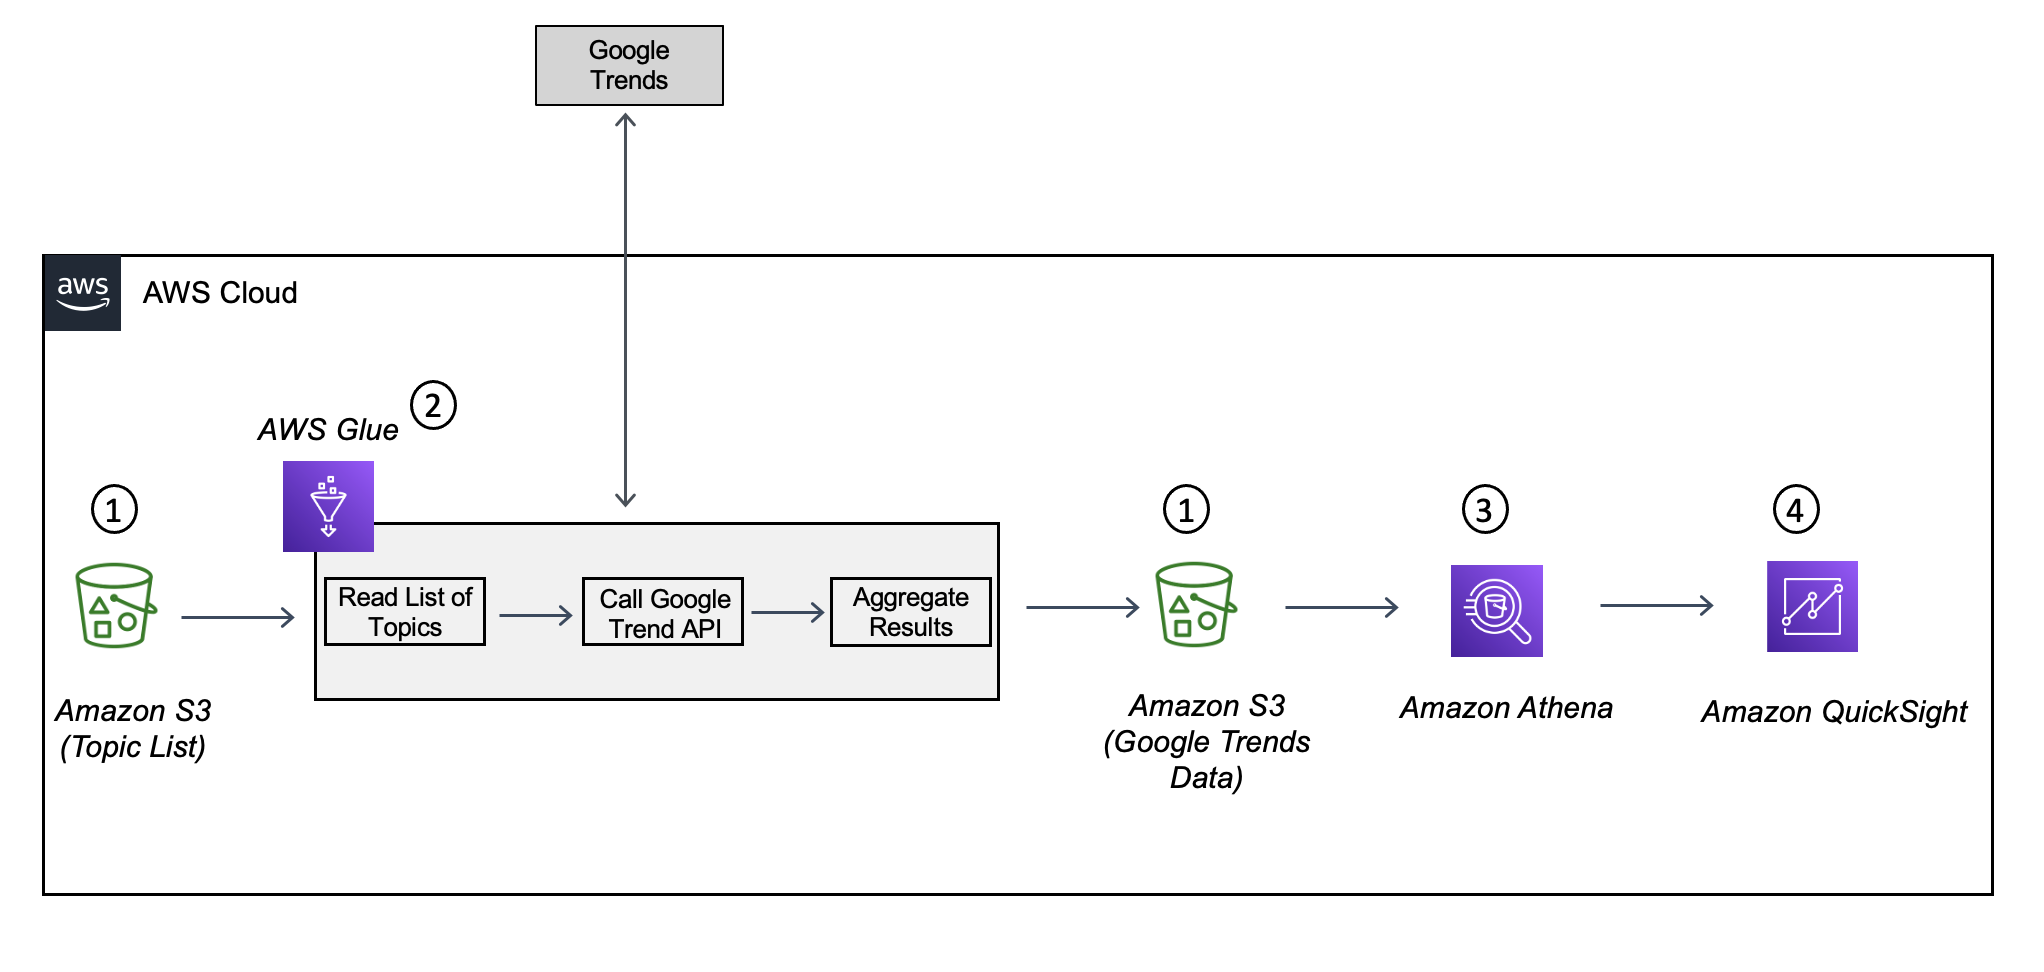
The solution consists of the following components:
- Amazon S3 – The storage layer that stores the list of topics for which Google Trends data has to be gathered. It also stores the results returned by Google Trends.
- AWS Glue – The serverless data integration service that calls Google Trends for the list of topics to get the search results, aggregates the data, and loads it to Amazon S3.
- Athena – The query engine that allows you to query the data stored in Amazon S3. You can use it for supporting one-time SQL queries on Google Trends data and for building dashboards using tools like Quick Sight.
- Quick Sight – The reporting tool used for building visualizations.
In the following sections, we walk through the steps to set up the environment, download the libraries, create and run the AWS Glue job, and explore the data.
Set up your environment
Complete the following steps to set up your environment:
- Create an S3 bucket where you upload the list of movies and TV shows. For this post, we use a Netflix Movies and TV Shows public dataset from Kaggle.
- Create an AWS Identity and Access Management (IAM) service role that allows AWS Glue to read and write data to the S3 buckets you just created.
- Create a new Quick Sight account with the admin/author role and access granted to Athena and Amazon S3.
Download the external libraries and dependencies for the AWS Glue Job
The AWS Glue job needs the following two external Python libraries: pytrends and awswrangler. pytrends is a library that provides a simple interface for automating the downloading of reports from Google Trends. awswrangler is a library provided by AWS to integrate data between a Pandas DataFrame and AWS repositories like Amazon S3.
Download the following .whl files for the libraries and upload them to Amazon S3:
- pytrends – pytrends-4.8.0-py3-none-any.whl
- awswrangler – awswrangler-2.14.0-py3-none-any.whl
Create and configure an AWS Glue job
To set up your AWS Glue job, complete the following steps:
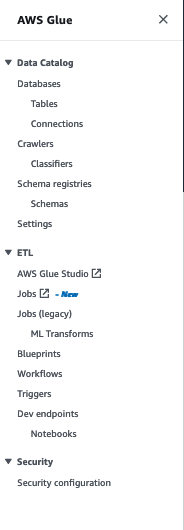
- On the AWS Glue console, under ETL in the navigation pane, choose Jobs – New.

- For Create job, select Python Shell script editor.
- For Options, select Create a new script with boilerplate code.
- Choose Create.

- On the Script tab, enter the following script, replacing the source and target buckets with your bucket names:
- On the Job details tab, for Name, enter the name of the AWS Glue job.
- For IAM Role, choose the role that you created earlier with permissions to run the job and access Amazon S3.
- For Type, enter
Python Shellto run the Python code. - For Python Version, specify the Python version as Python 3.6.
- For Data processing units, choose 1 DPU.
- For Number of retries, enter
3.

- Expand Advanced properties and under Libraries, enter the location of the S3 bucket where the
pytrendsandawswranglerfiles were downloaded.

- Choose Save to save the job.


Run the AWS Glue job
Navigate to the AWS Glue console and run the AWS Glue job you created. When the job is complete, a CSV file with the Google Trends values is created in the target S3 bucket with the prefix specified in the main() function. In the next step, we create an AWS Glue table referring to the target bucket and prefix to allow queries to be run against the Google Trends data.
Create an AWS Glue table on the Google Trends data
In this step, we create a table in the AWS Glue Data Catalog using Athena. The table is created on top of the Google Trends data saved in the target S3 bucket.
In the Athena query editor, select default as the database and enter the following DDL command to create a table named trends. Replace the target bucket and prefix with your own values.
This table has three columns:
- date – The time dimension for aggregating the data. In this example, the time period is monthly.
- google_trend – The count of Google Trends values normalized on a scale of 0–100.
- title – The name of the movie or TV show.
Query the data using Athena
Now you can run one-time queries to find the popularity of movies and TV shows.
In the first example, we find the top 10 most popular movies and TV shows for November 2021. In the Athena query editor, enter the following SQL command to query the trends table created in the previous step:

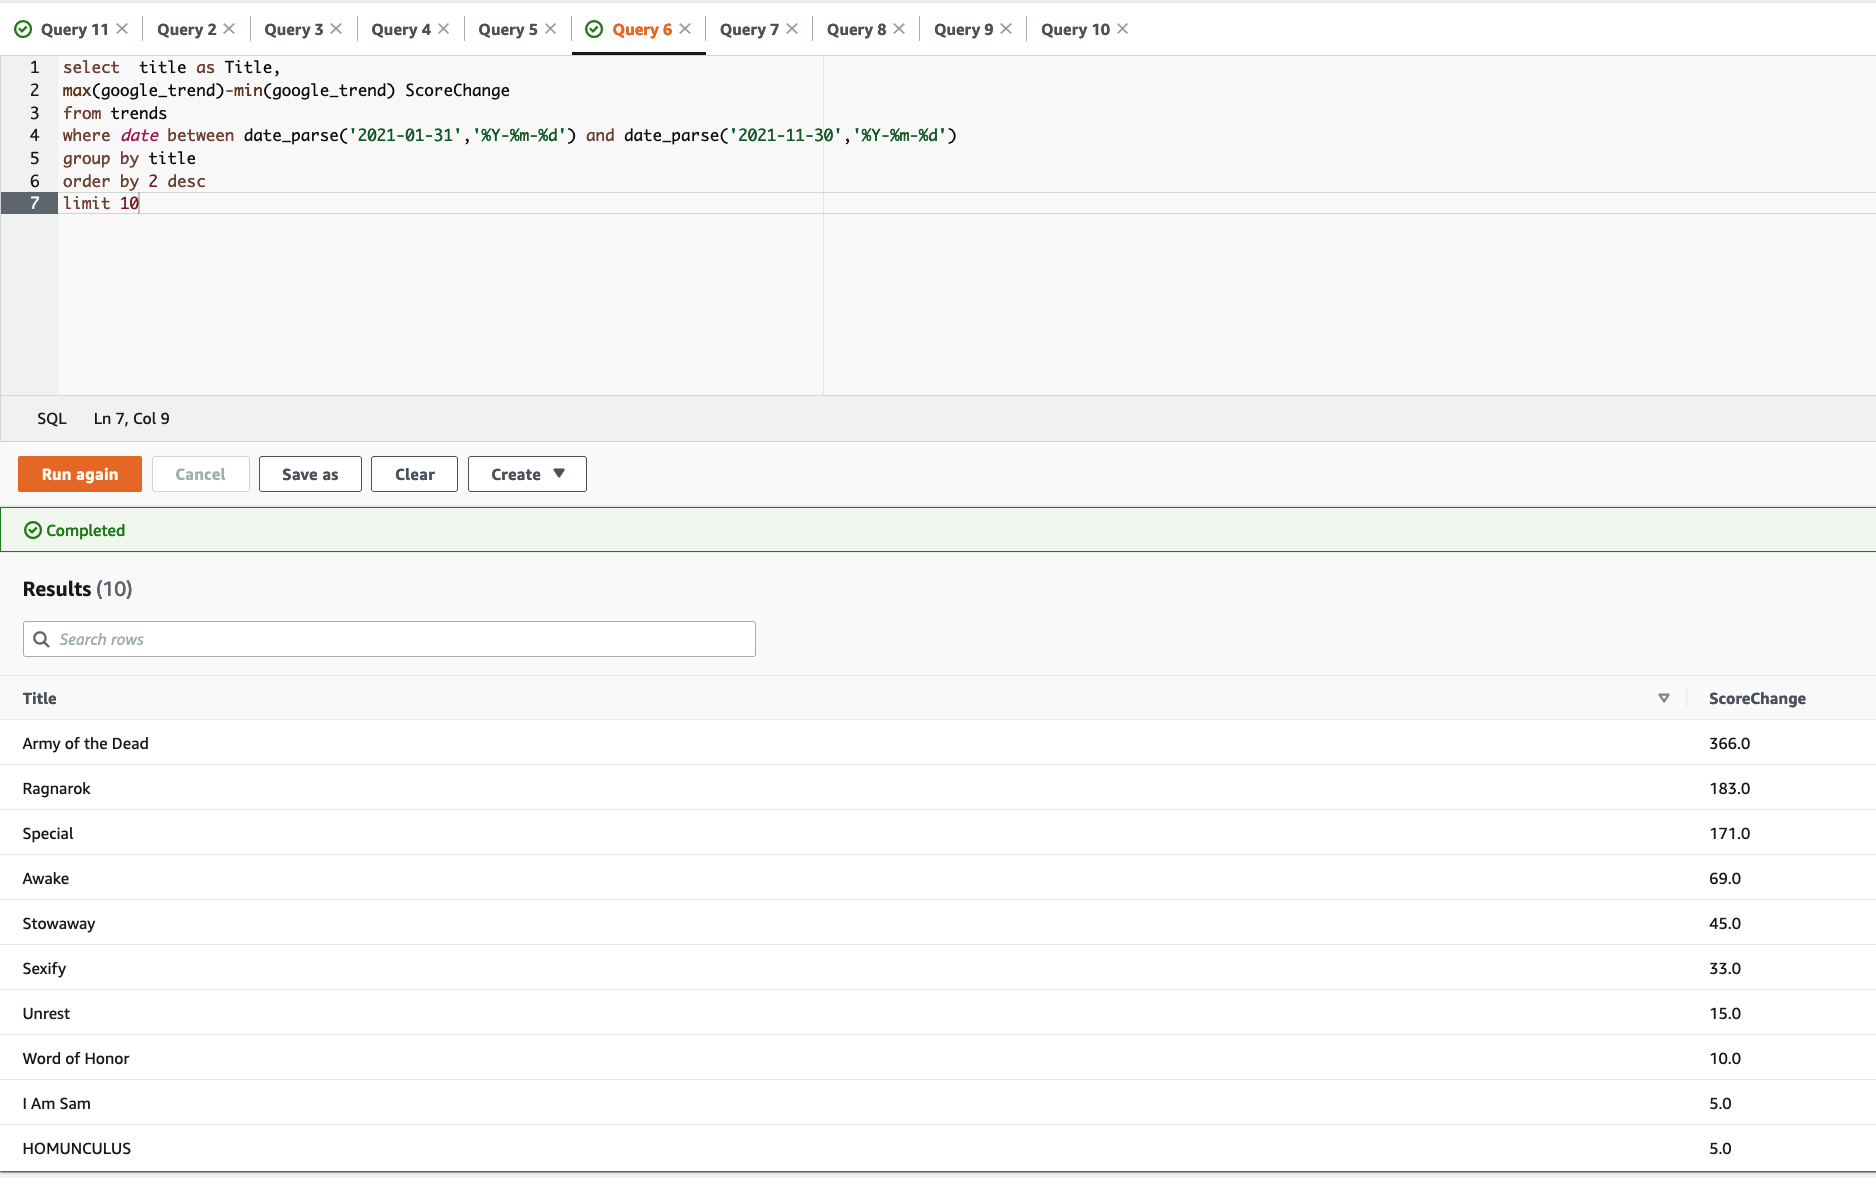
In the following example, we find the top 10 most popular movies and TV shows that have grown most in popularity in 2021 until November 30. In the Athena query editor, enter the following SQL command to query the trends table:
Build a dashboard to visualize the data using Quick Sight
We can use Quick Sight to build a dashboard on the data downloaded from Google Trends to identify top movies and TV shows. Complete the following steps:
- Sign in to your Quick Sight account.
- On the Quick Sight console, choose Datasets and choose New dataset.
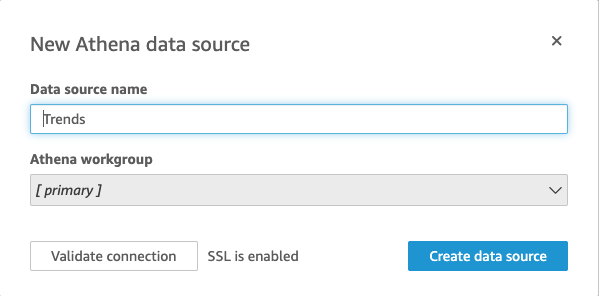
- Choose Athena as your data source.
- For Data source name, enter a name.
- For Athena workgroup, choose [primary].
- Choose Create data source.

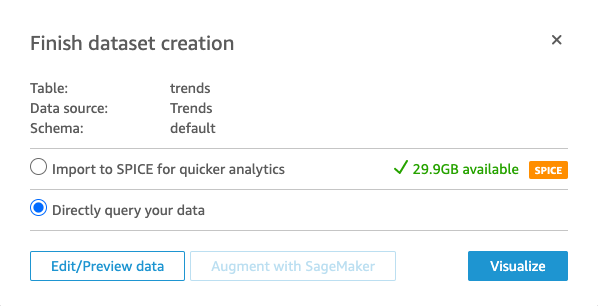
- For Database, choose default.
- For Tables, select the
trendstable. - Choose Select.

- Select Directly query your data.
- Choose Visualize.


For the first visual, we create a bar chart of the top movies or TV shows by title sorted in ascending order of aggregated Google Trends values.
- Choose the horizontal bar chart visual type.
- For Y axis, choose title.
- For Value, choose google_trend (Average).


Next, we create a time series plot of Google Trends count by month for titles.
- Add a new visual and choose the autograph visual type.
- For X axis, choose date.
- For Value, choose google_trend (Sum).
- For Color¸ choose title.


Clean up
To avoid incurring future charges, delete the resources you created for AWS Glue, Amazon S3, IAM, and Quick Sight.
- AWS Glue Catalog table
- On the AWS Glue console, choose Tables under Databases in the navigation pane.
- Select the AWS Glue Data Catalog table that you created.
- On the Actions drop-down menu, choose Delete.
- Choose Delete to confirm.
- AWS Glue Job
- Choose Jobs in the navigation pane.
- Select the AWS Glue job you created.
- On the Actions drop-down menu, choose Delete.
- S3 bucket
- On the Amazon S3 console, choose Buckets in navigation pane.
- Choose the bucket you created.
- Choose Empty and enter your bucket name.
- Choose Confirm.
- Choose Delete and enter your bucket name.
- Choose Delete bucket.
- IAM Role
- On the IAM console, choose Roles in navigation pane.
- Choose the role you attached to AWS Glue job.
- Choose Delete role.
- Choose Yes.
- Amazon Quick Sight
- If you created a Quick Sight user for trying out this blog and do not want to retain that access, please ask your Quick Sight admin to delete your user.
- If you created the Quick Sight account itself just for trying this blog and no longer want to retain it, use following steps to delete it.
- Choose your user name on the application bar, and then choose Manage Quick Sight
- Choose Account settings.
- Choose Delete Account.
You can only have one Quick Sight account active for each AWS account. Make sure that other users aren’t using Quick Sight before you delete the account.
Conclusion
Integrating external data sources such as Google Trends via AWS Glue, Athena, and Quick Sight can help you enrich your datasets to yield greater insights. You can use it in a data science context when the model is under-fit and requires more relevant data in order to make better predictions. In this post, we used movies as an example, but the solution extends to a wide breadth of industries, such as products in a retail context or commodities in a finance context. If the simple inventory histories or the transaction dates are available, you may find little correlation to future demand or prices. But with an integrated data pipeline using external data, new relationships in the dataset make the model more reliable.
In a business context, whether your team wants to test out a machine learning (ML) proof of concept more quickly or have limited access to pertinent data, Google Trends integration is a relatively quick way to enrich your data for the purposes of ML and data insights.
You can also extend this concept to other third-party datasets, such as social media sentiment, as your team’s expertise grows and your ML and analytics operations mature. Integrating external datasets such as Google Trends is just one part of the feature and data engineering process, but it’s a great place to start and, in our experience, most often leads to better models that businesses can innovate from.
About the Authors
 Drew Philip is a Sr. Solutions Architect with AWS Private Equity. He has held senior
technical leadership positions within key AWS partners such as Microsoft, Oracle, and
Rackspace. Drew focuses on applied engineering that leverages AI-enabled digital innovation and development, application modernization, resiliency and operational excellence for workloads at scale in the public and private sector. He sits on the board of Calvin University’s computer science department and is a contributing member of the AWS Machine Learning Technical Focus Community.
 Gautam Prothia is a Senior Solution Architect within AWS dedicated to Strategic Accounts. Gautam has more than 15+ years of experience designing and implementing large-scale data management and analytical solutions. He has worked with many clients across industries to help them modernize their data platforms on the cloud.
 Simon Zamarin is an AI/ML Solutions Architect whose main focus is helping customers extract value from their data assets. In his spare time, Simon enjoys spending time with family, reading sci-fi, and working on various DIY house projects.
This is a companion discussion topic for the original entry at https://aws.amazon.com/blogs/big-data/enhance-analytics-with-google-trends-data-using-aws-glue-amazon-athena-and-amazon-quicksight/