This is a guest post by Faye Crompton from Forwood Safety. Forwood provides fatality prevention solutions to organizations across the globe.
At Forwood Safety, we have a laser focus on saving lives. Our solutions, which provide full content and proven methodology via verification tools and analytical capabilities, have one purpose: eliminating fatalities in the workplace. We recently realized an ambition to provide interactive, dynamic data visualization tools that enable our end users to access safety data in the field, regardless of their experience with analytics and data reporting.
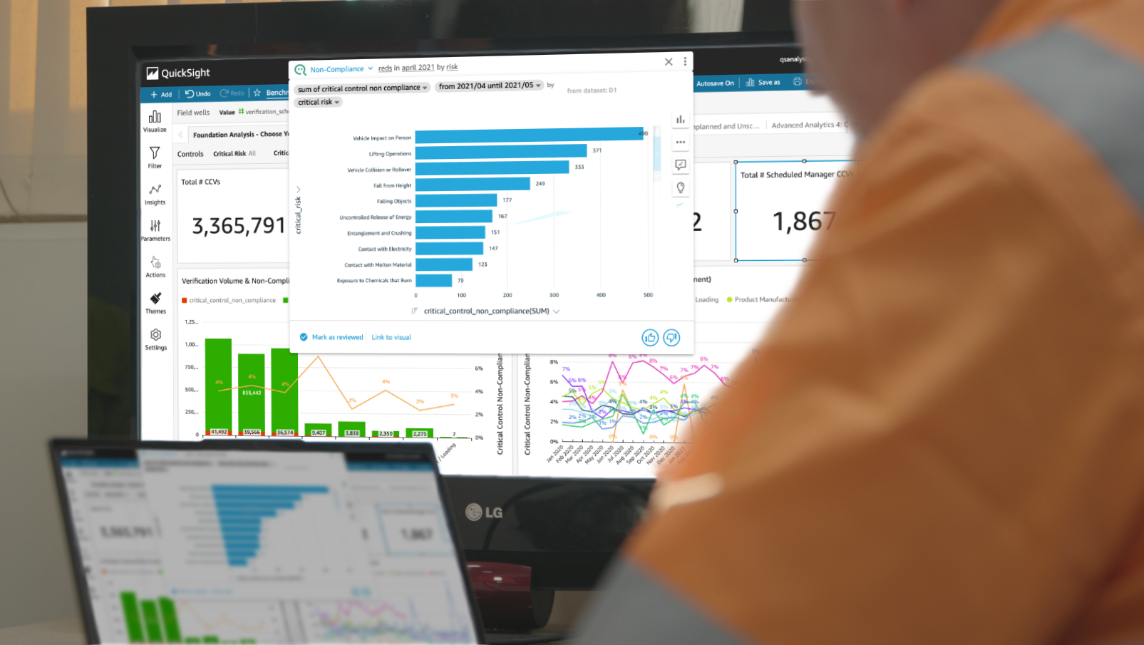
In this post, I’ll talk about how Amazon Quick Sight Q solved these challenges by giving users fast data insights through natural language querying capabilities.
Driving data insights with Quick Sight
Forwood’s Critical Risk Management (CRM) solution provides organizations with globally benchmarked and comprehensive critical control checklists and verification controls that are proven to prevent fatalities in the workplace. CRM protects frontline workers from serious harm by helping change the culture of risk management for companies. In addition, our Forwood Analytical Self-Service Tool (FAST) enables our customers to use self-service reporting to get updated dashboards that display key safety and fatality prevention metrics.
For several years, we used AWS Quick Sight to provide data visualization for our CRM and FAST reporting products, with great success. Most of our technology stack was already based on AWS, so we knew Quick Sight would be easy to integrate. Quick Sight is agnostic in terms of data sources and types, and it’s a very flexible tool. It’s also an open data technology, so it can accept most of the data sources that we throw at it. Most importantly, it ties in seamlessly with our own architecture and data pipelines in a way that our previous BI tools couldn’t. After we implemented Quick Sight, we started using it to power both CRM and FAST, visualizing risk data and serving it back to our customers.
Using Quick Sight Q to help site supervisors get answers quickly
Furthering our focus on innovation and usability; we identified a common challenge that we believed Quick Sight could solve through our FAST application on behalf of our clients — we needed to make risk data more accessible for those of our clients who aren’t data analysts. We recognize that not everyone is an analyst. We also have mining industry customers who are not frequently accessing our applications via desktop. For example, mining site Supervisors and Operators working deep underground typically have access only via their mobile devices. For these users, it’s easier for them to ask the questions relevant to their specific use cases as needed at point of use, rather than filter and search through a dashboard to find the answers ahead of time.
Quick Sight Q was the perfect solution to this challenge. Quick Sight Q is a feature within Quick Sight that uses machine learning to understand questions and how they relate to business data. The feature provides data insights and visualizations within seconds. With this capability, users can simply type in questions in natural language to access data insights about risk and compliance. Mining site workers, for example, can ask if the site is safe or if the right verification processes are in place. Health and safety teams and mining site supervisors can ask questions such as “Which sites should I verify today?” or “Which risk will be highest next week?” and receive a chart with the relevant data.
Making data more accessible to everyone
Quick Sight Q gives our on-site customers near-real-time risk and compliance data from their mobile devices in a way they couldn’t before. With Quick Sight Q, we can give our FAST users the opportunity to quickly visualize any fatality risks at their sites based on updated fatality prevention data. All users, not just analysts, can identify worksites that have a higher fatality risk because the data can show trends in non-compliance with safety standards. Our clients no longer have to look in a dashboard for the answers to their questions; those looking at a dashboard can go beyond the dashboard and ask deeper questions.
Quick Sight Q solved one of our main BI challenges: how to make risk data more accessible to more people without extensive user training and technical understanding. Soon, we hope to use Quick Sight Q as part of a multidimensional predictive dataset using deep learning models to deliver even more insights to our customers.
We look forward to extending our use of Quick Sight. When we first started using it, it was strictly for analytics on our existing data. More recently, we started using API deployments for Quick Sight. We have many different clients, and we use the API feature to maintain master versions of all 30+ standard reports, and then deploy those dashboards to as many clients as we need to via code. Previously, we saw Quick Sight as a function of our analytics products; now we see it as a powerful and flexible toolkit of analytics features that our developers can build with.
Additionally, we look forward to relying on Quick Sight Q to bring life-saving safety analytics to more people. Quick Sight Q bridges the gap between the data a company has and the decisions that company needs to make, and that’s very powerful for our clients. Forwood Safety is driven to eradicate workplace fatalities, and by getting data to more people and making it easy to access, we can make our solutions more effective, saving more lives.
About the author
 Faye Crompton is Head of Analytics, Safety Applications and Computer Vision at Forwood Safety. She leads work on analytics and safety products that reduce fatality risk in mining and other high-risk industries.
This is a companion discussion topic for the original entry at https://aws.amazon.com/blogs/big-data/forwood-safety-uses-amazon-quicksight-q-to-extend-life-saving-safety-analytics-to-larger-audiences/