Amazon Quick Sight is a fully-managed, cloud-native business intelligence (BI) service that makes it easy to create and deliver insights to everyone in your organization or even with your customers and partners. You can make your data come to life with rich interactive charts and create beautiful dashboards to share with thousands of users, either directly within a Quick Sight application or embedded in web apps and portals.
In the previous post in this two-part series, we discussed drag handlers to alter height and width for rows, columns, and table headers. Now, let’s look at some of the new interactivity options for rows and columns for tables and pivot tables.
Hide or show fields for authors
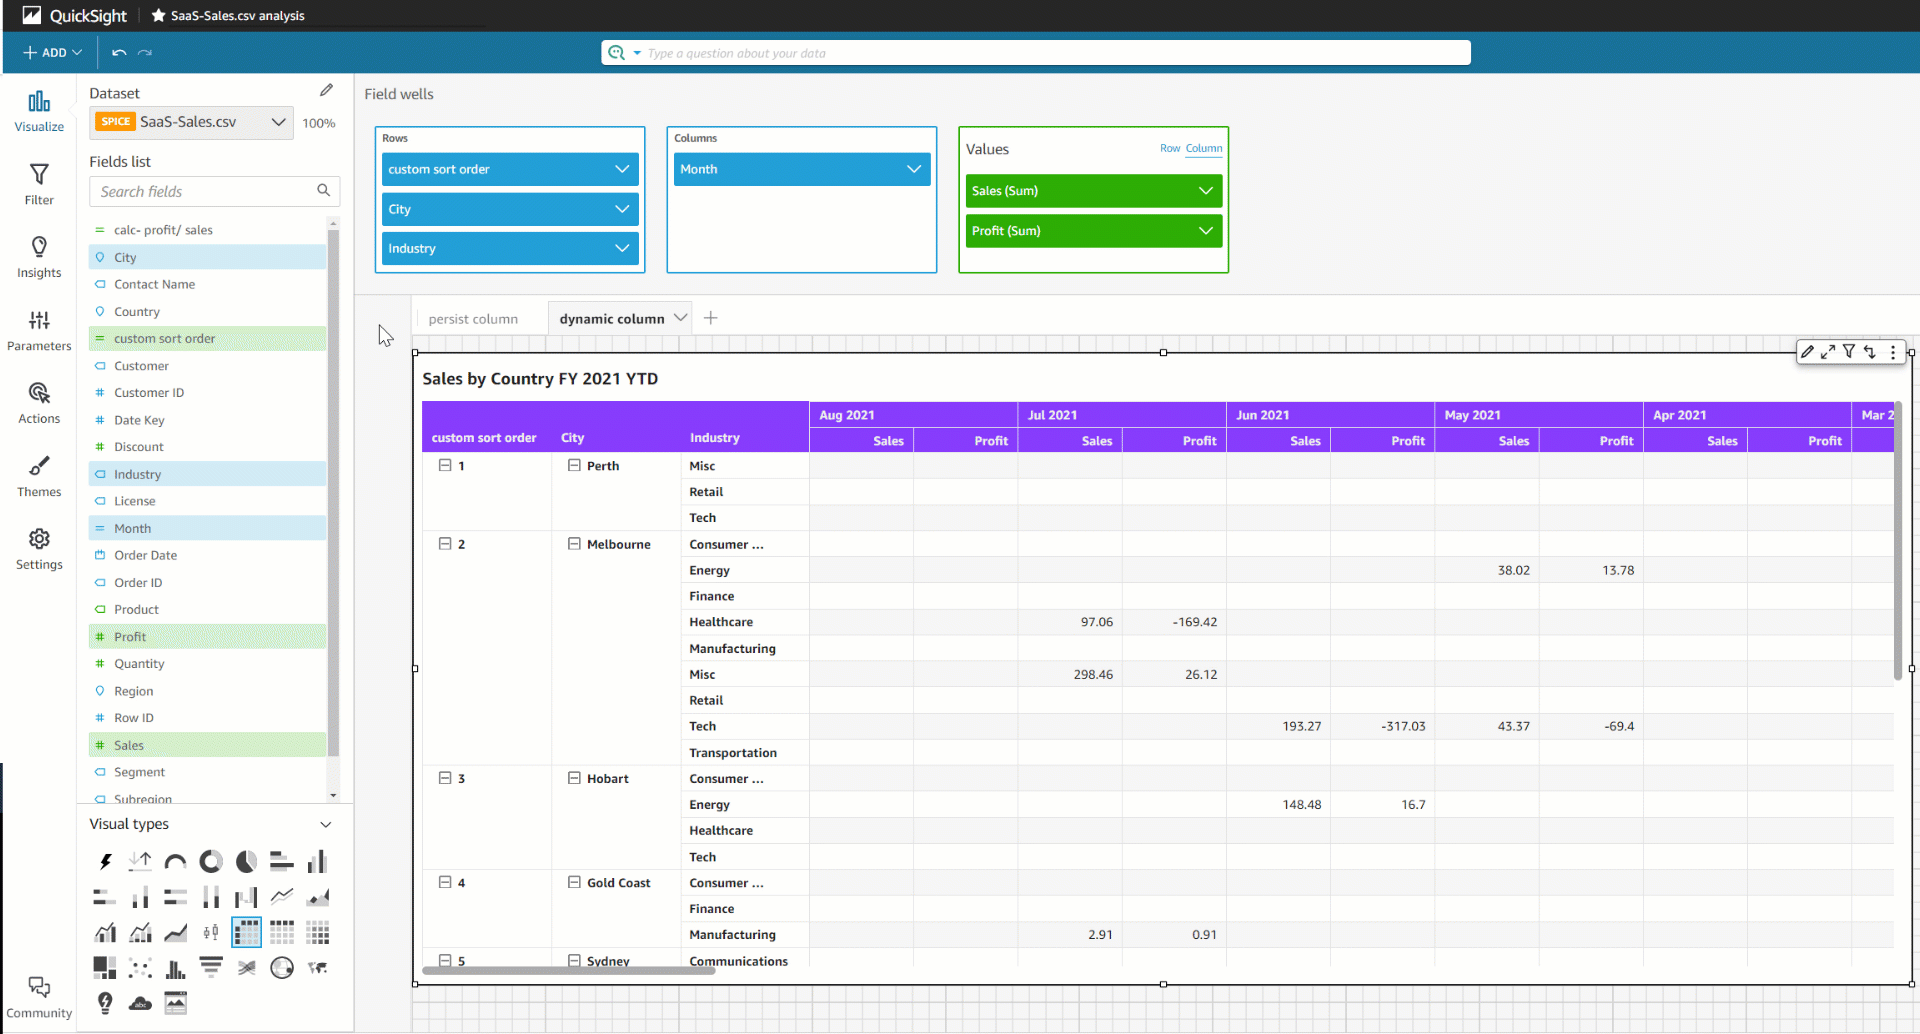
Previously, authors could only hide fields in tables. Now we’re extending this feature to pivot tables as well. Authors can hide rows, columns, and values from either the field wells or from the column or row field headers in pivot tables. For easier identification, hidden fields are indicated with a cross eye icon; you can revert them back to visible using the Show all hidden fields option.
Let’s look at some of the use cases where this could be helpful:
- Define actions on a pivot table and hide fields to save real estate – Sometimes, you may want to hide fields in a pivot table whose sole purpose is to enable actions, like opening another webpage and pass this hidden field as a parameter.
- Use hidden fields to define a custom sort order – You can define a custom sort order for your pivot table using hidden fields, for example, defining a specific order for your PNL reports.
- Display two tables side by side as a single visual – In the following example, we show sales by country, where table 1 displays the last 4 weeks of data and table 2 displays monthly data from the last 4 weeks.

- Create butterfly tables – Another variation of displaying tables side by side is to create butterfly tables where values are displayed on both sides of the dimension. This is a great way to compare two sets of values. For example, you can compare the current month vs. a full year of data.


Export hidden fields for authors and readers
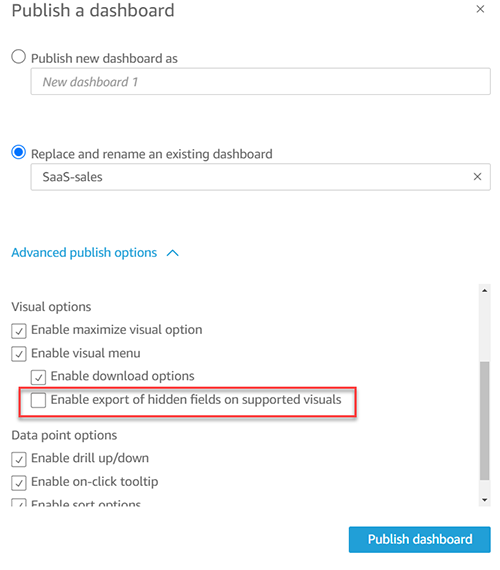
Not only can authors hide fields, they can also control the ability for readers to export data including the hidden fields or without them. When publishing the analysis, authors have the new option Enable export of hidden fields on supported visuals. When you select this option, readers are able to include hidden fields when exporting their data. The default setting is to keep this disabled and only allow readers to export visible data.
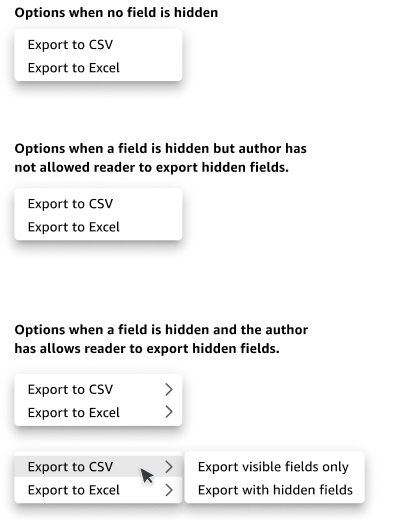
Based on the different scenarios, the following options show up for exporting data to CSV and Excel from tables and pivot tables.
Summary
In this post, we looked at the new capability of toggling row, column, and value field visibility on tables and pivot tables. We also discussed the various use cases for hiding fields and the new exporting options associated with field visibility, which can be controlled by authors. To learn more about table and pivot table formatting options, refer to Formatting tables and pivot tables in Amazon Quick Sight.
Try out the new feature and share your feedback and questions in the comments section below.
About the author
 Bhupinder Chadha is a senior product manager for Amazon Quick Sight focused on visualization and front end experiences. He is passionate about BI, data visualization and low-code/no-code experiences. Prior to Quick Sight he was the lead product manager for Inforiver, responsible for building a enterprise BI product from ground up. Bhupinder started his career in presales, followed by a small gig in consulting and then PM for xViz, an add on visualization product.
This is a companion discussion topic for the original entry at https://aws.amazon.com/blogs/big-data/part-2-new-row-and-column-interactivity-options-for-tables-and-pivot-tables-in-amazon-quicksight/