Amazon Quick Sight Q uses machine learning (ML) to enable any user to ask questions about business data in natural language and receive accurate answers with relevant visualizations in seconds. Today, Amazon Quick Sight announces support for two new question types that simplify and scale complex analytical tasks using natural language: “forecast” and “why.”
In this post, we explore each of these new question types with examples of how to use them.
Prerequisites
The features explored in this post are part of Quick Sight Q. If you’re an existing Quick Sight user, be sure that the Q add-on is enabled. For steps on how to do this, see Getting Started with Amazon Quick Sight Q.
Forecasting questions
Customers often ask how they can forecast future business performance. This is a useful tool to understand if things are proceeding well, or if some action may be needed to get back on track. Forecasting uses historic data to project metrics into the future.
Creating forecasts is often the job of analysts or data scientists. However, the new forecasting question type in Q enables non-analyst users to predict future trajectories for up to three measures simultaneously. Rather than learning formulas or parameter settings, you can get a forecast by entering forecast into the language bar, followed by up to three metrics that you want to see predictions for. This natural language approach is an easy and intuitive way for managers and others who depend on data to get a sense of what’s likely to happen if things don’t change.
Although the experience of creating a forecast in Q is simple, under the hood is a proven and robust forecasting algorithm called Random Cut Forest (RCF). For more information, see How RCF is applied to generate forecasts.
How to ask a forecasting question
To ask a forecasting question, start the question with the word forecast or the phrase Show me a forecast. The minimum information needed to create a forecast is one of these two question starters, plus the measure you want to forecast. For example, Forecast sales is enough to generate a forecast, as shown in the following screenshot.

Forecasting in Q also supports filters. Filters are applied by adding information to the question. The following example shows using a filter in a forecast statement.

Q allows you to forecast up to three numeric measures in a single question. The following example shows a forecast of sales, profit, and quantity.
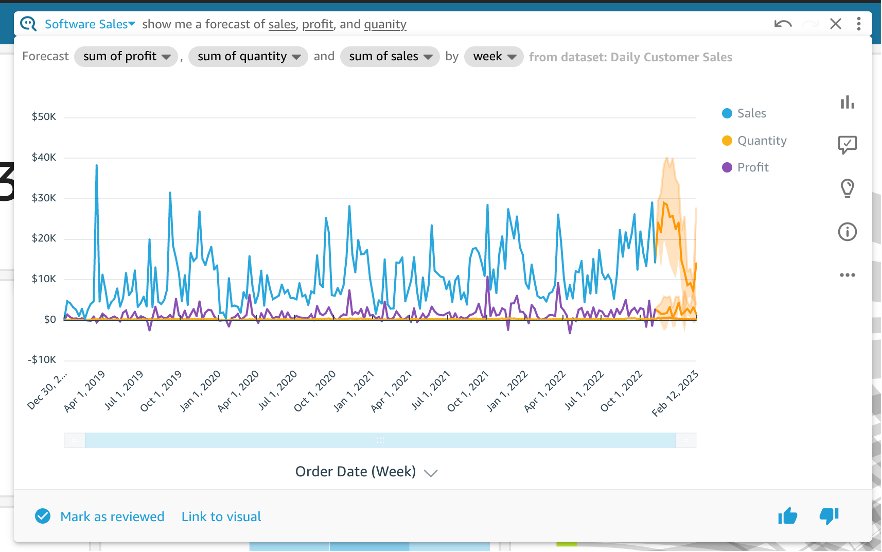
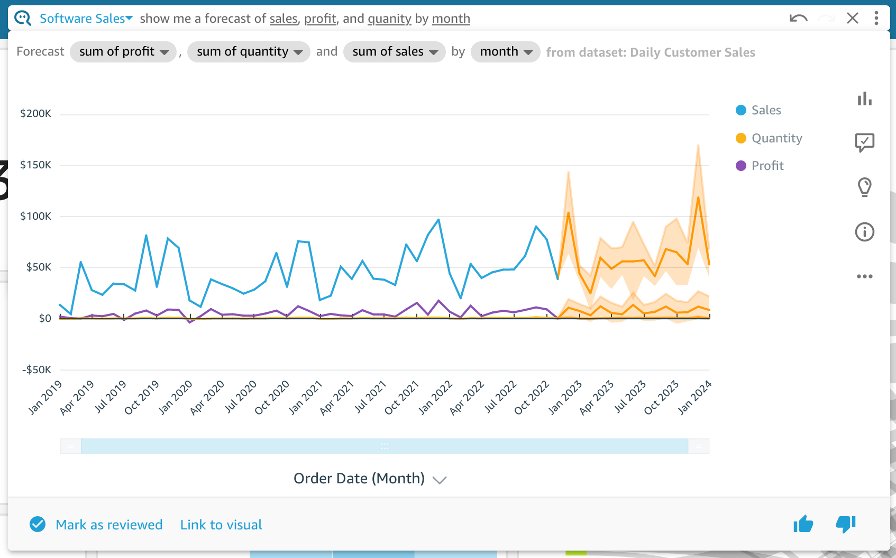
If the data you have is dense, it can cause the forecast to be crowded into the right side of the visual. Adjusting the time granularity to a coarser step, such as going from weekly granularity to monthly, will help make the visual easier to read. To do this, simply specify the desired time granularity in the question. The following example shows a different view of the previous example grouped by month instead of week.
Note that at this release forecasting in Q doesn’t support dimensional group-by functionality. Dimensional group-bys split the forecast by the different values in a categorical field, for example: Show me a forecast of sales by region.
Why questions
“Why” is one of the most fundamental questions people ask. For many organizations, understanding why is the key to delighting customers, driving innovation, and outmaneuvering the competition. However, manually analyzing a body of data to discover contributing changes is difficult, time-consuming, and requires special analytics skill.
The new why question type enables business users to instantly get insights previously only accessible to trained analysts. Business users need to understand what contributed to changes in their data, so they can make decisions about what action to take. Why questions are easy to ask and natural to think of, so business users can quickly pinpoint insights they need to know.
When you ask a why question in Q, you trigger an on-the-fly contribution analysis that will automatically identify the key drivers of change for the measure you asked about and quantify which value from each driver contributed the most to that change. This gives you an idea of the relative influence each value had to the measure.
How to ask a why question
A why question needs three things:
- To start with the word “why.”
- A numeric measure, such as sales, enrollment numbers, profit, price, and so on.
- A date or time span, such as last quarter, January 2022, or last month. Note that at this release the time span should be complete, but asking about ongoing spans such as “this week” or “this year” or specifying the current month will not yet work.
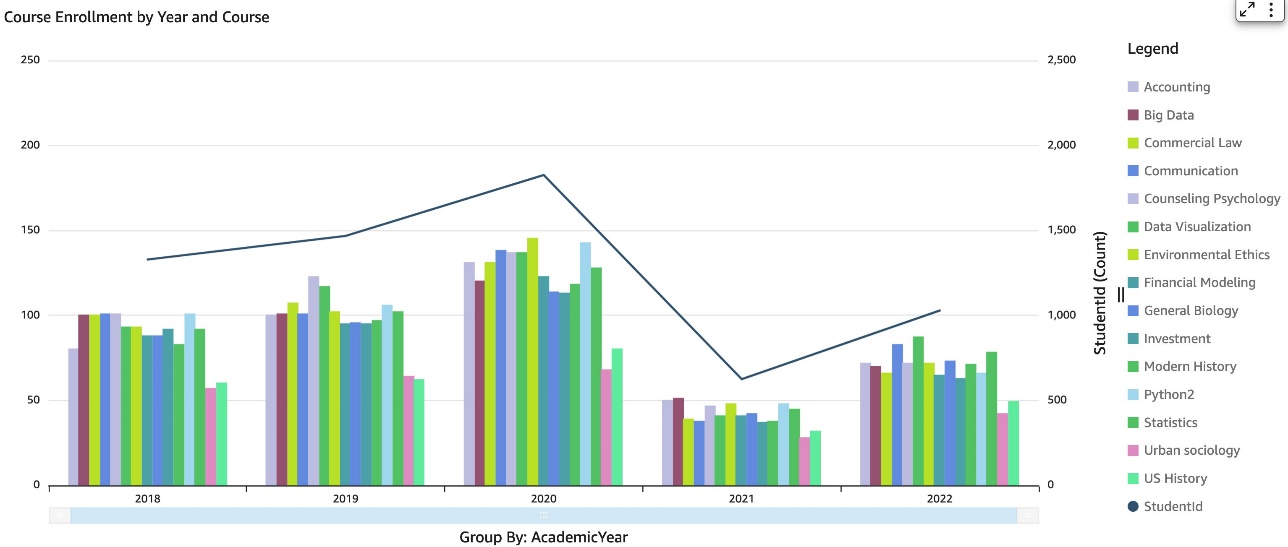
Why questions often start from seeing something that sparks our curiosity. For example, if I were an administrator reviewing student enrollment and I saw the following visual, I would naturally wonder “Why did enrollment drop in 2021?”
Now we can ask just that, as shown in the following screenshot.
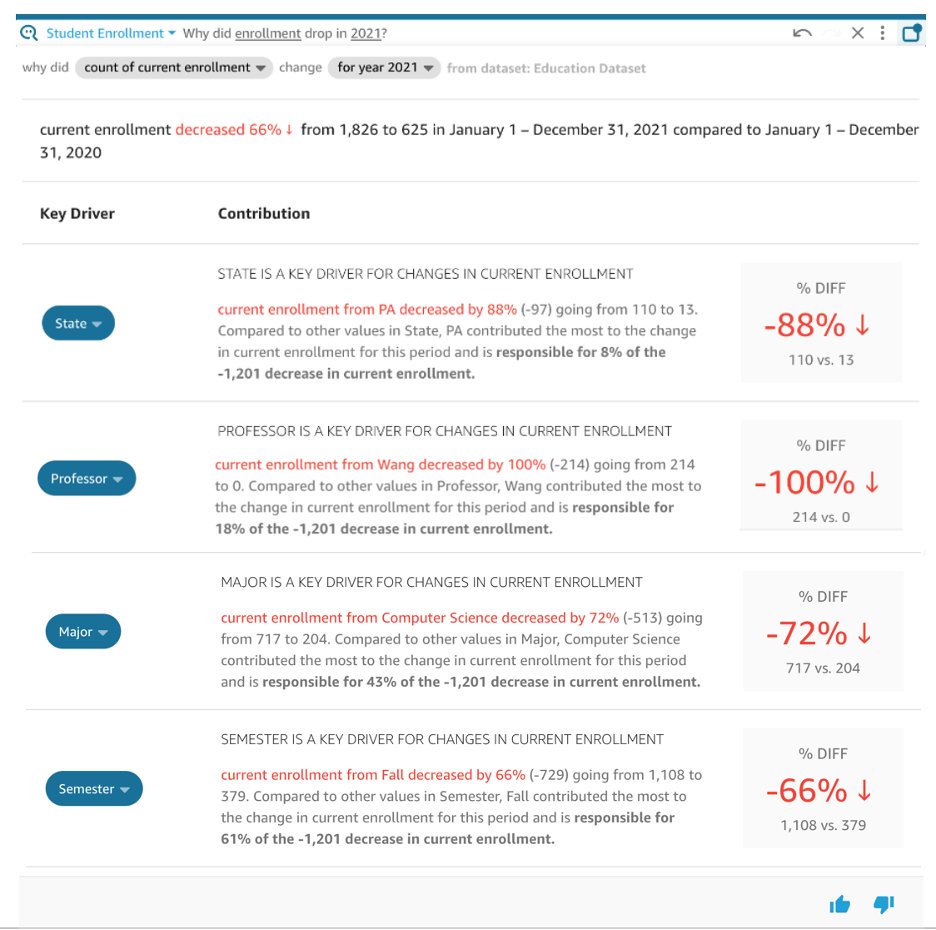
The why answer identifies up to four key drivers (shown in the blue ovals on the left side of the answer), which get unpacked into contribution narratives (center of the answer) that describe the specific value from the key driver that played the biggest role. On the right side of the answer is a quick-view KPI that summarizes the change in the key driver value. Note that you may need to mouse over and scroll in the Q answer pane to see all the drivers.
Refining why questions
In the why answer displayed in the previous example, enrollment dropped more in the fall semester, which is why it appears as a top contributor to the drop in enrollment. To drill into the factors that influenced the drop in fall enrollment, you can ask more precise questions. In this case, adding in the fall to the end of the question focuses the analysis on just the fall semester.
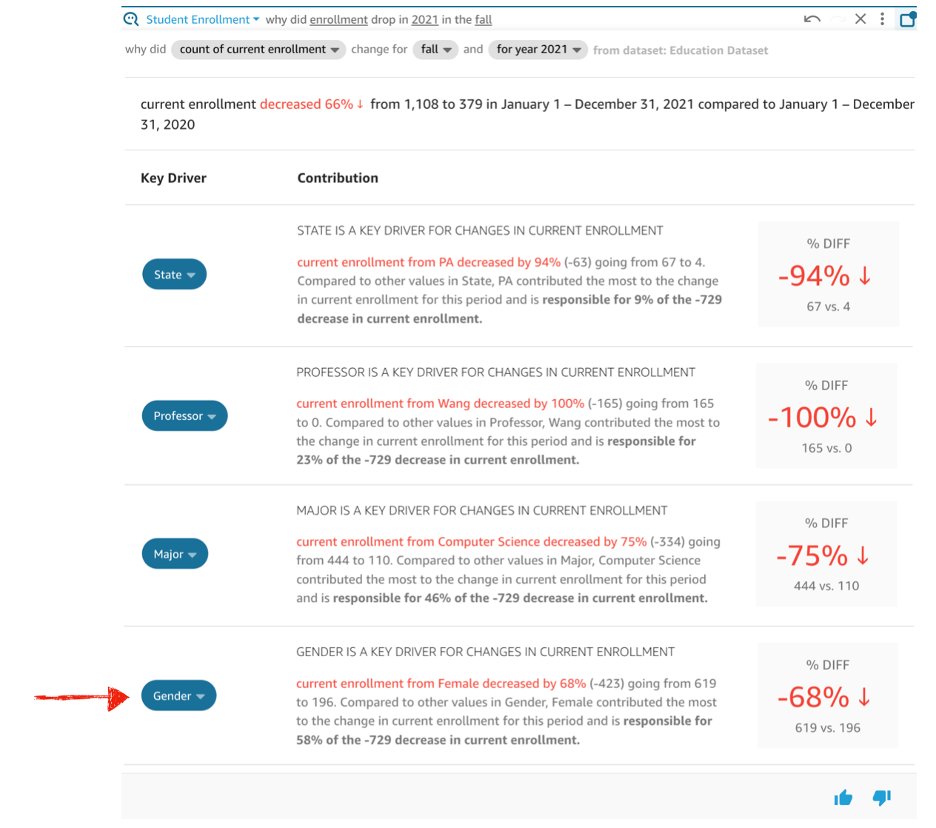
Focusing on fall brings more specific metrics, and reveals gender is an additional key driver specific to that semester.
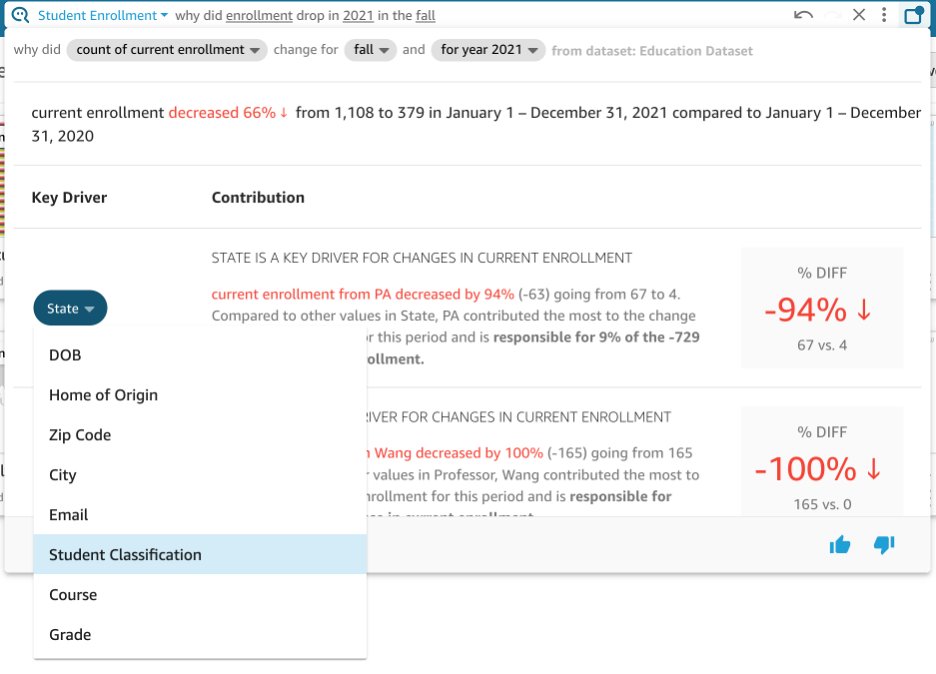
You can explore additional drivers by choosing the driver and changing to a different field. This can be a helpful way understand the impact of another variable or to avoid redundancy if the data structure led Q to recommend two very similar or overlapping dimensions.
In the following example, we can change State to Student Classification to explore if the drop in enrollment disproportionately impacted any particular student group, such as freshman or graduate students.
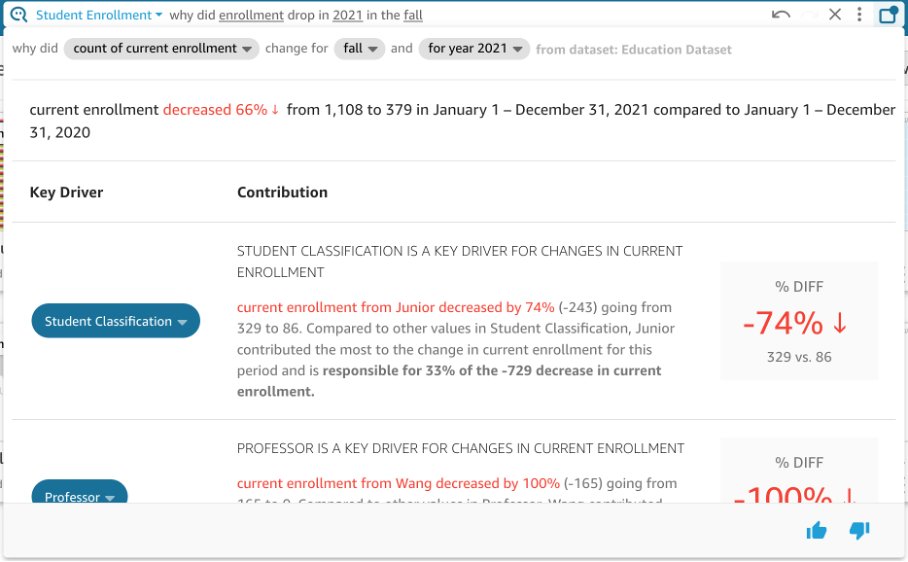
In the following result, enrollment from juniors (third-year students) was much lower than it was in 2020, and represents a large portion of the drop in enrollment.
Conclusion
With why and forecasting questions, business users can dig deeper to understand the contributing factors of metric changes or model potential growth. These new question types are available at no additional cost for all Q customers.
The examples used in post utilize the sample Quick Sight topics that come included with your Quick Sight subscription. For forecasting, we used the Software Sales sample topic, and for why questions, we used the Student Enrollment sample topic. To try the questions on your own, activate the applicable sample topic.
About the author
Shannon Kalisky is a Senior Product Manager – Technical that covers natural language question patterns and model robustness for Amazon Quick Sight Q.

This is a companion discussion topic for the original entry at https://aws.amazon.com/blogs/big-data/new-analytical-questions-available-in-amazon-quicksight-q-why-and-forecast/